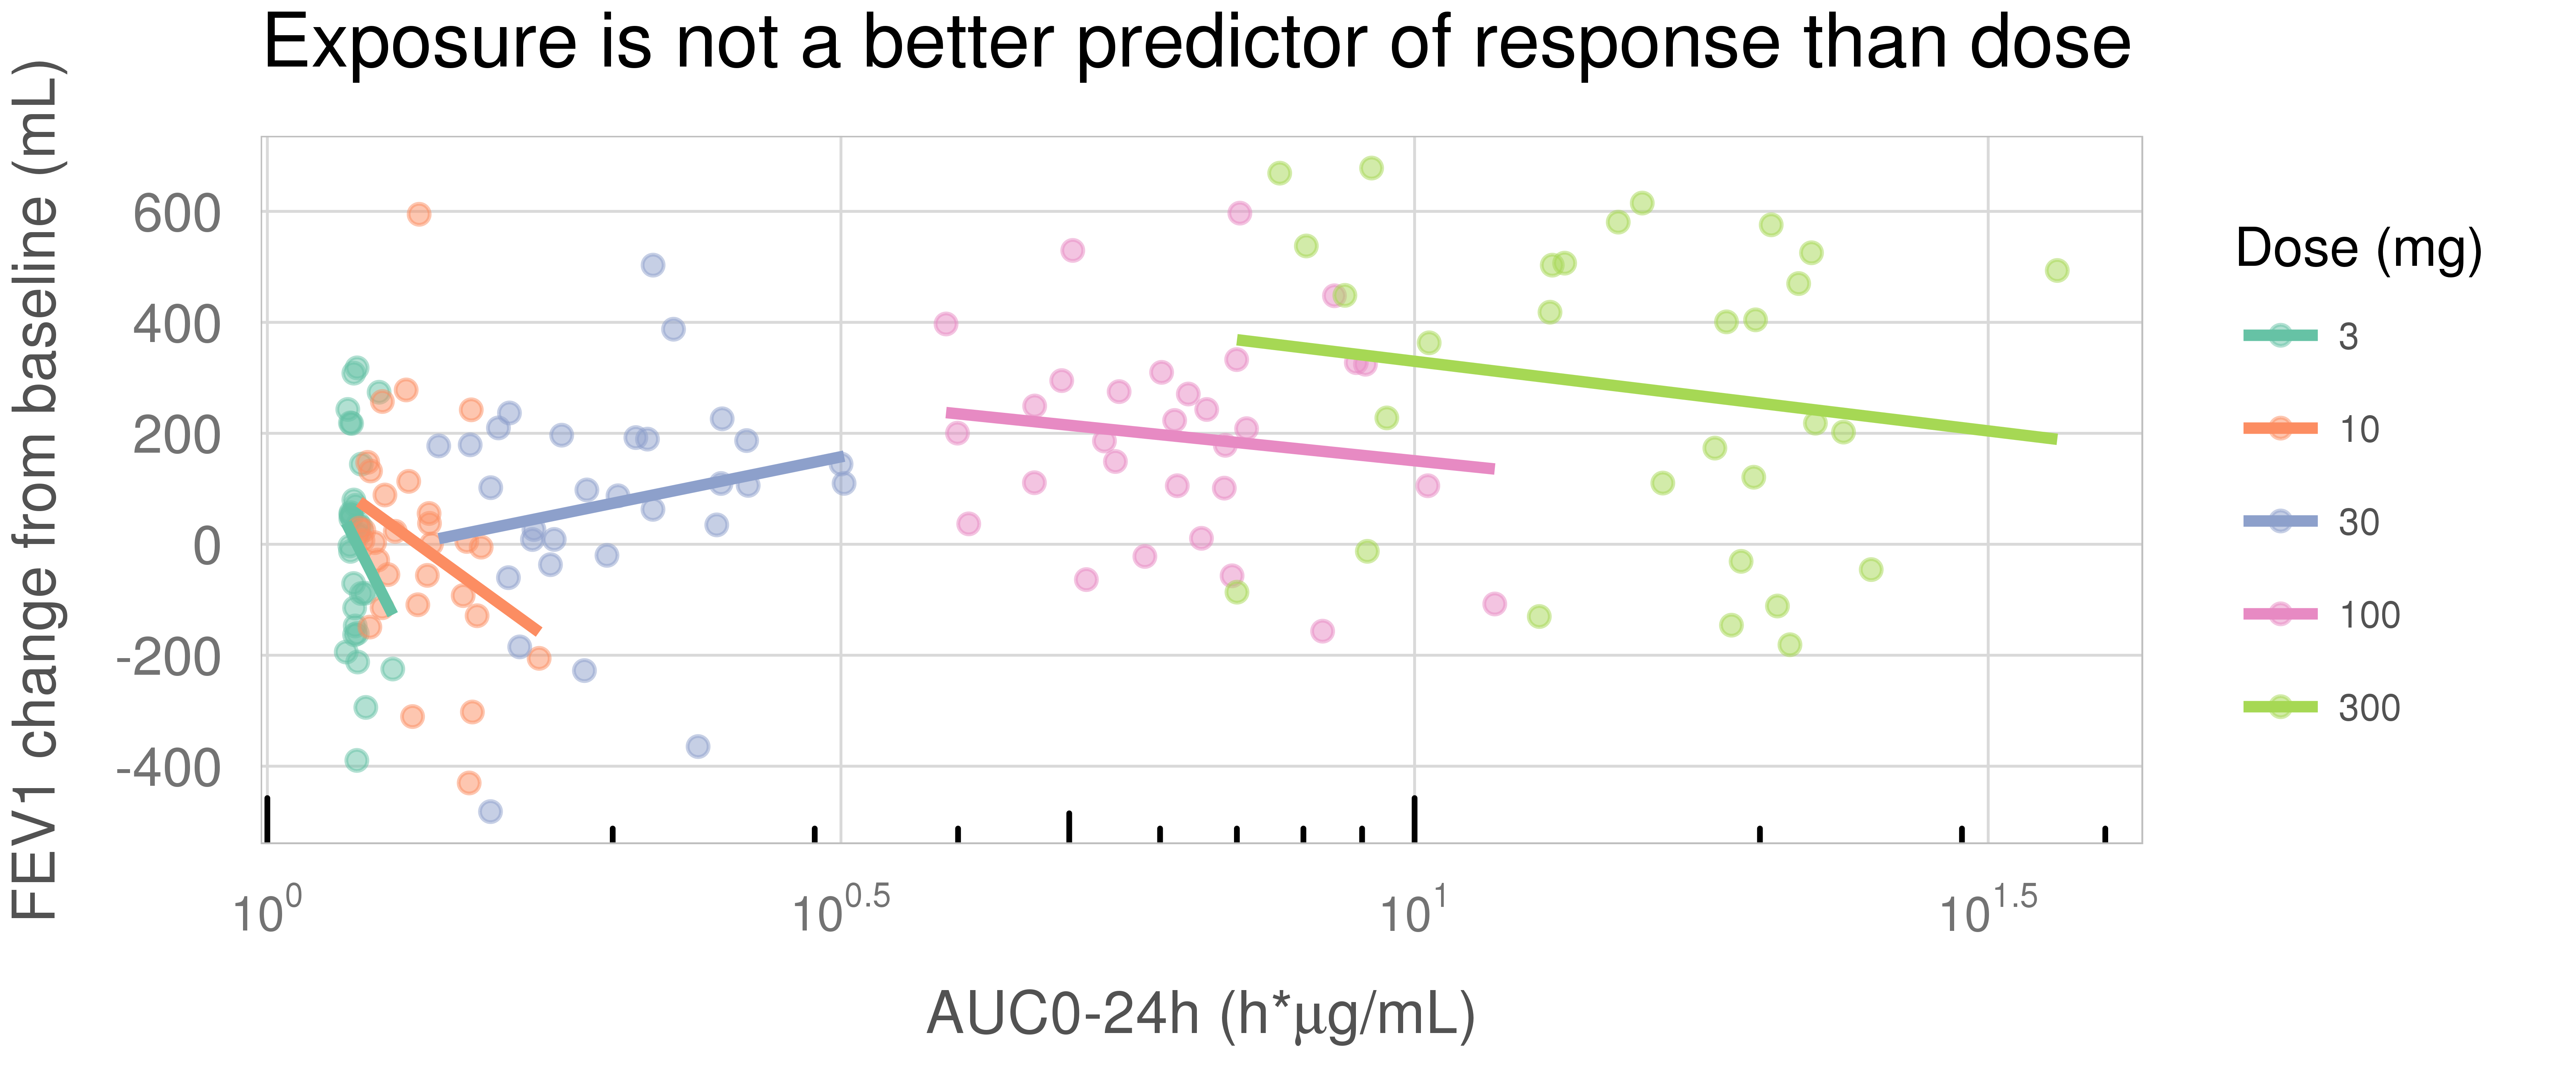
In the tutorial we posit three laws of Effective Visual Communication for the quantitative scientist: have a clear purpose, show the data clearly, and make the message obvious. The tutorial provides more granularity on these laws; it covers the Graphics Principles Cheat Sheet; and it discusses the application of both in four Case Studies.

These laws and recommendations are illustrated in a collection of case study notebooks. Example code from the tutorial is also available.
An earlier pre-print of the tutorial can also be found at: https://arxiv.org/abs/1903.09512