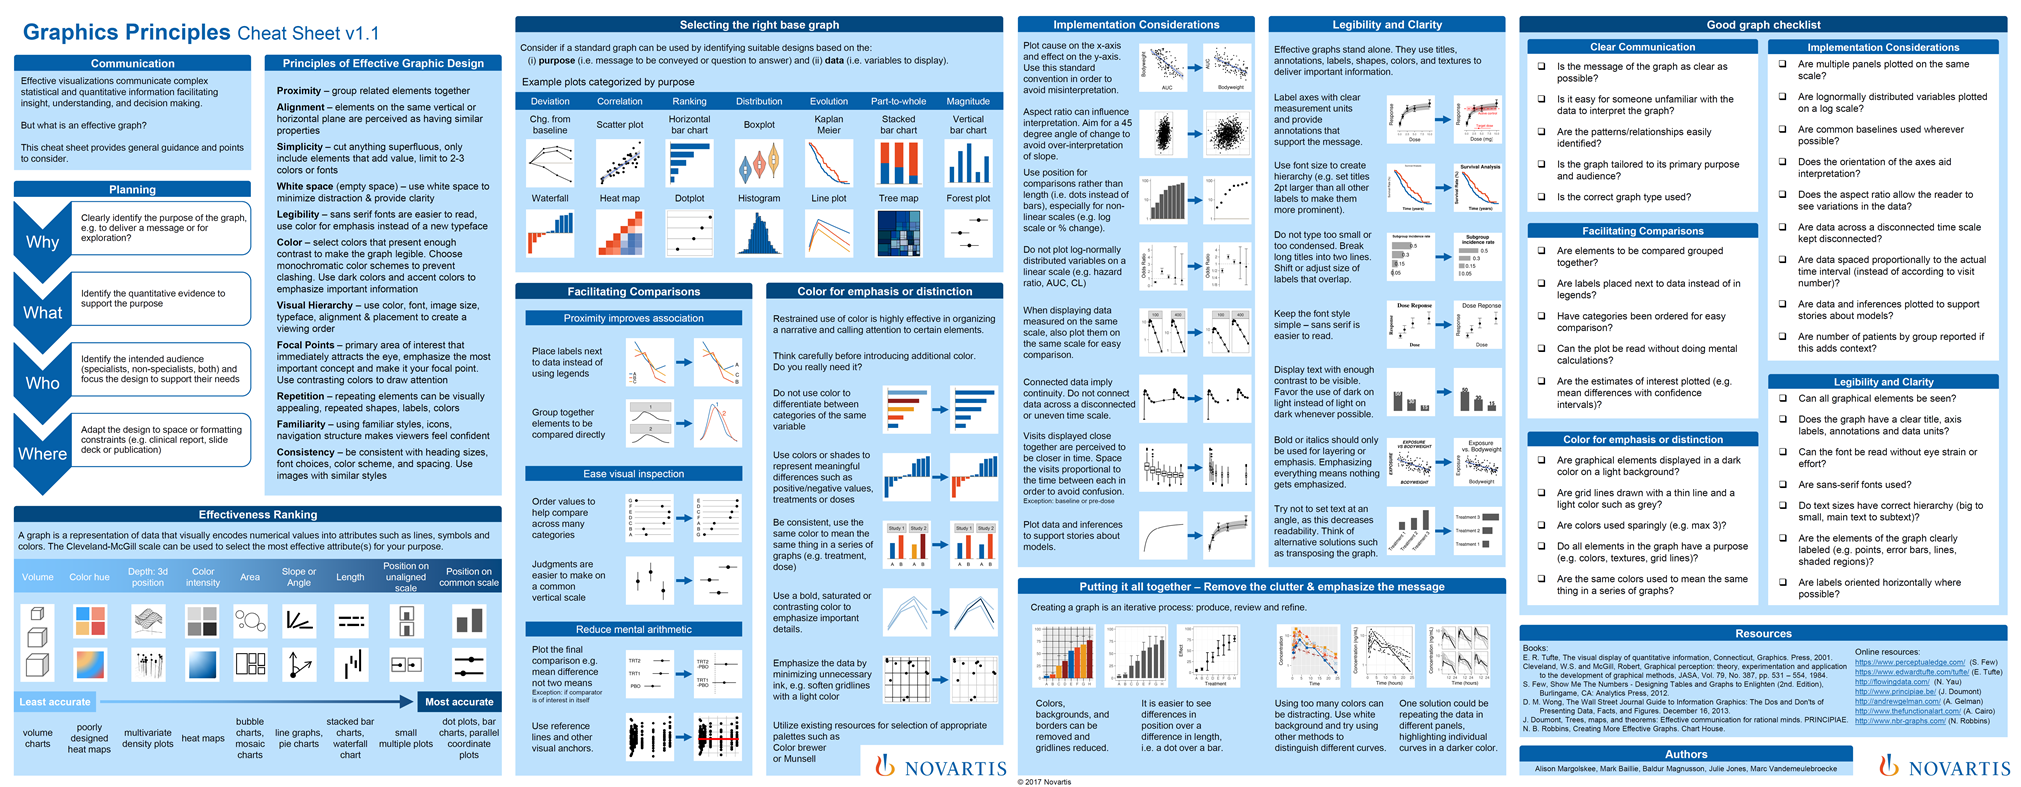
Graphics Principles Cheat Sheet
cheat sheet
principles
A concise and accessible resource for everyday practical use.
Three laws of visual communication
three laws
principles
for the quantitative scientist. Effective visual communication follows three laws: 1.) Have a clear purpose; 2.) Show the data clearly; and 3.) Make the message obvious. These three laws correspond to the three main ingredients of any quantitative work: purpose, data, and message. Getting these right leads to success; failing in any of them leads to overall failure.
Clear lines, clear signal
line plot
symbols
clarity
Rcode
example
Weniger aber besser (Less but better) - Dieter Rams.
Kieran Healy
fundamentals
principles
Rcode
example
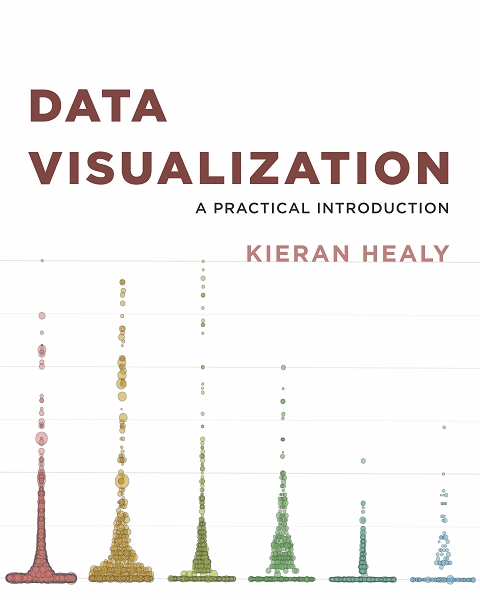
Data Visualization for Social Science: A practical introduction with R and ggplot2.
Compared to what?
comparisons
scatter plot
annotations
Rcode
examples
layering
visual anchors
At the heart of quantitative reasoning is a single question: Compared to what? - Edward Tufte
R Graph Gallery
principles
Rcode
example
python
d3
An online collection of graphs and charts written mainly but not exclusively written in R.
No matching items


